
Fig. 5.
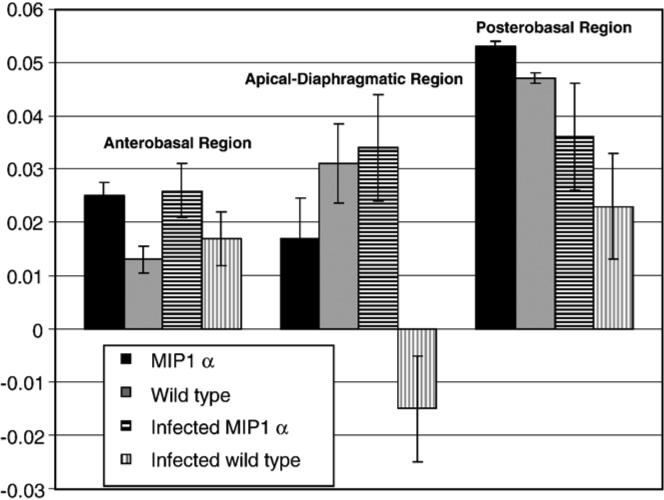
Normalized wall motion by region. Bar graph (mean±S.E.M.) of normalized wall motion by heart region for the four groups of mice showing the dyskinesis in the infected wild-type mice in the apical–diaphragmatic region.
Official websites use .gov
A
.gov website belongs to an official
government organization in the United States.
Secure .gov websites use HTTPS
A lock (
) or https:// means you've safely
connected to the .gov website. Share sensitive
information only on official, secure websites.
Normalized wall motion by region. Bar graph (mean±S.E.M.) of normalized wall motion by heart region for the four groups of mice showing the dyskinesis in the infected wild-type mice in the apical–diaphragmatic region.