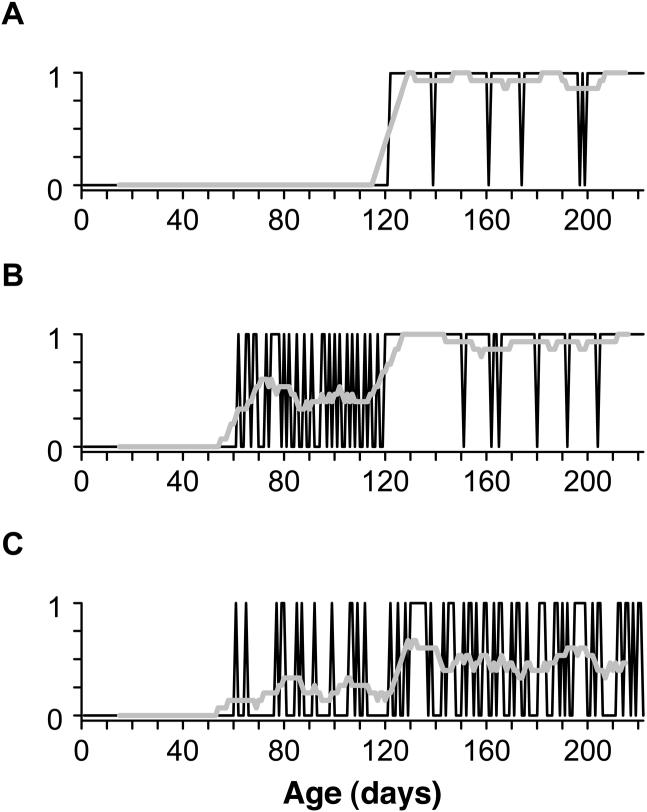
Figure 5.
Simulated developmental trajectories (dark lines) generated by a simple Markov switching model. In each graph, the first 60 days represents a period where the behavior of interest is not yet expressed (p = 0), and the final 100 days represents a period of consistent expression in which the behavior occurs at a stable rate < 1. (a) A stage-like trajectory involving an abrupt transition from absence (extended through the first 120 days) to a high base rate of occurrence (p = .95) during the period of stable expression. (b) Trajectory involving an intervening acquisition period (from day 61 to day 120) before achieving a stable period with a high base rate (p = .95). During the acquisition period, behavior is generated by randomly switching between the early regime (absence) and the later period of stability (high base rate). (c) Trajectory involving an intervening acquisition period before a stable period with a lower base rate (p = .5). Regime switching occurs in the same way as in (b). In all three graphs, the thicker gray line shows a 15-day moving average that depicts the same data; in graphs (b) and (c), this smoothing function visually demarcates the variable acquisition period from the later period of stable expression.

