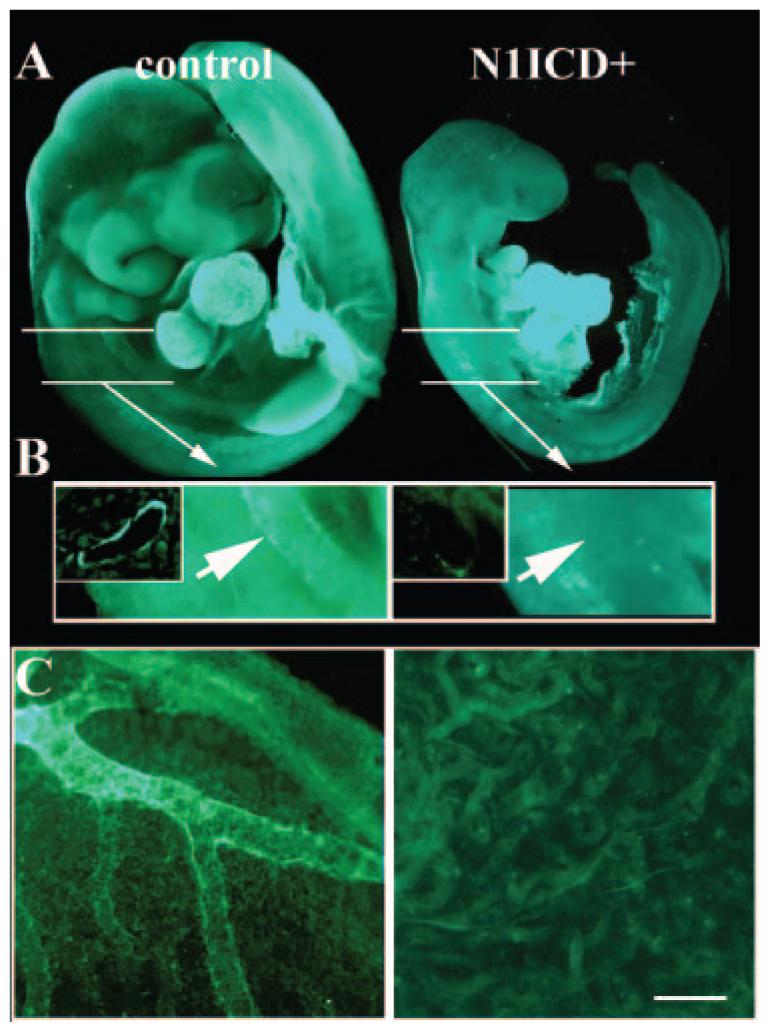
Figure 6.

Notch1 activation in Tie2 populations inhibits smooth muscle investment of vessels. Immunostaining for smooth muscle α-actin (SMA) was performed on E9.5 embryos. A, SMA expression in the developing heart was comparable in control (left) and N1ICD+ (right) embryos. White lines indicate magnified region in B. B, SMA-positive cells are identifiable surrounding the aorta in controls (arrow, left), whereas none was seen in N1ICD+ embryos (arrow, right). In the N1ICD+ embryos, some fluorescence is seen in the dorsally located somites. The insets for both images show sections through the aorta, showing SMA-positive layers in only controls. C, Yolk sacs from control (left) or N1ICD+ (right) embryos were stained for SMA. Control yolk sacs had vessels with mural cell investment, but there was no SMA staining in the rudimentary network in yolk sacs from N1ICD+ embryos (right). The scale bar in F represents 100 μm for A and 140 μm for C.
