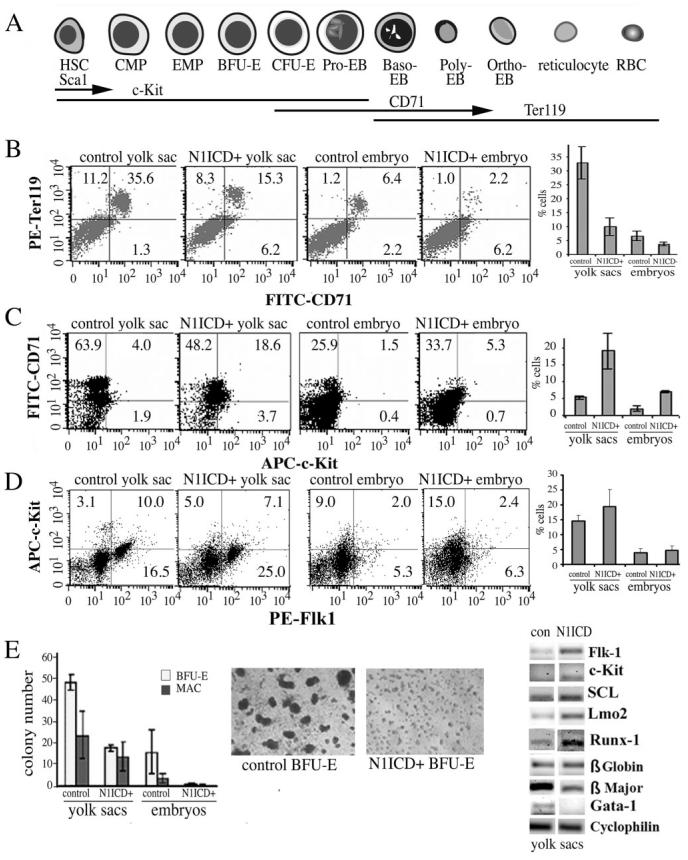
Figure 8.
Impaired erythroid differentiation in N1ICD+ embryos. A, Representation of erythroid differentiation and marker expression. Flow cytometry was used to analyze cell surface antigens from embryos or yolk sacs at E9.5. B, CD71+ and Ter119+ populations are shown and graphed are double CD71+/ Ter199+ populations in each group. C, CD71+ and c-Kit+ populations are shown, and graphed are the percentages of CD71+/c-Kit+ double positive cells, showing increased c-Kit+ progenitors in N1ICD+ groups. D, Analysis of Flk1+ and c-Kit+ double positive population did not show significant differences but progenitors positive for Flk1 alone were significantly increased in N1ICD+ groups (graphed). E, Methylcellulose colony-forming assays were used to quantify BFU-E and macrophage-forming colonies from yolk sacs and embryos. Shown are representative photomicrographs of BFU-E colonies 8 days after plating. E, RT-PCR was performed using primers as indicated.

