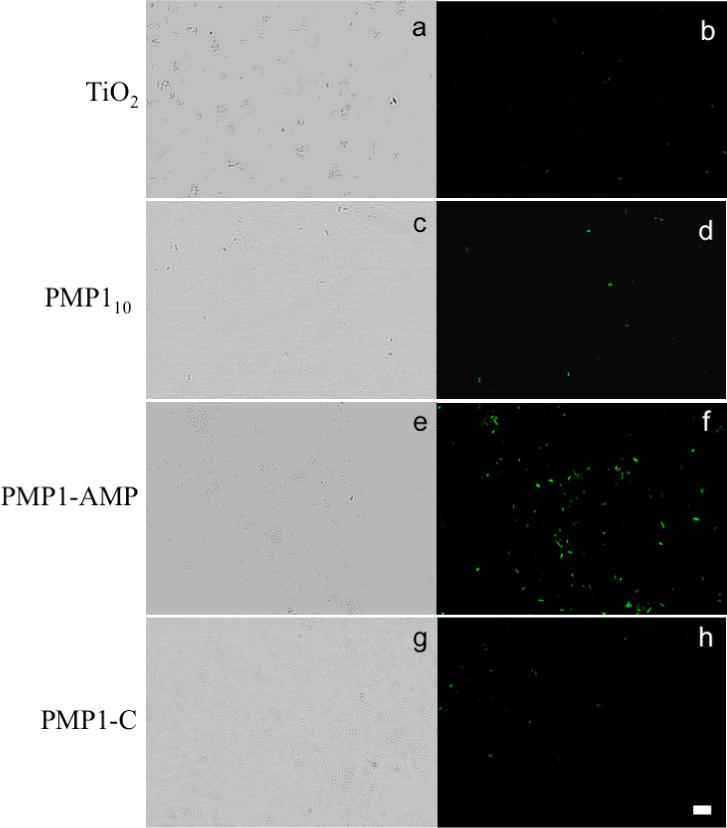
Figure 3.

Confocal microscopy images (phase contrast images on left and fluorescent images on right) for E. coli after 2 h incubation on: bare TiO2 (a and b), PMP110 (c and d), PMP1-AMP (e and f), and PMP1-C (g and h) modified substrates. Scale bar = 10 μm.
