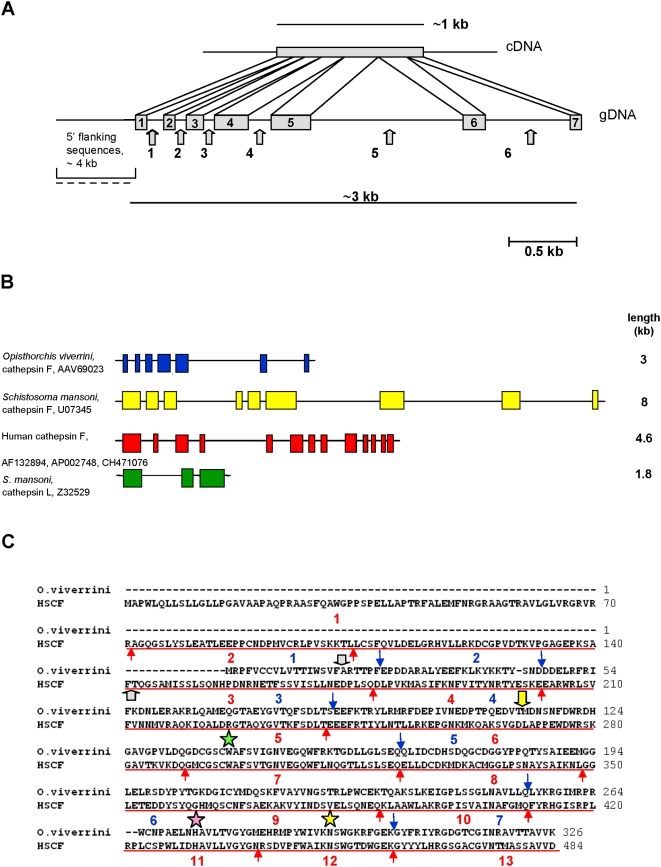
Figure 2. Genome structure of the cathepsin F gene of Opisthorchis viverrini.
(A) Structure of the O. viverrini cathepsin F gene locus, as determined by nucleotide sequence analysis of a ∼3 kb PCR product of genomic DNA of O. viverrini. The top panel shows the size of the cDNA while the bottom panel shows a schematic of positions and relative sizes of the 7 exons and 6 introns (arrowed) that comprise the gene. The 5′-flanking region was generated by inverse PCR. (B) Schematic to compare the structure and exon numbers of the C1 family genes, including the cathepsin F genes of O. viverrini, Schistosoma mansoni, and Homo sapiens, and the cathepsin L gene of S. mansoni. Colored blocks represent exons, thin lines represent introns, and the asterisks identify the exon(s) that encodes the catalytic Cys residue. Database accession numbers are provided for the illustrated sequences. (C) Comparison of the exon/intron structures of O. viverrini cathepsin F and human cathepsin F. The two enzymes were aligned for maximal homology and the amino acid sequences corresponding to an exon for each protein was separated by red (human cathepsin F) or blue (O. viverrini cathepsin F) arrows. Exon numbering is shown below the blocks of amino acid sequences. Positions of the active site triad of Cys, His and Asn residues are indicated with stars. The position of signal sequence cleavage site is indicated with gray arrows, and the position of FhCL1 trans-processing cleavage site between prosegment and mature enzyme indicated with the yellow arrow.

