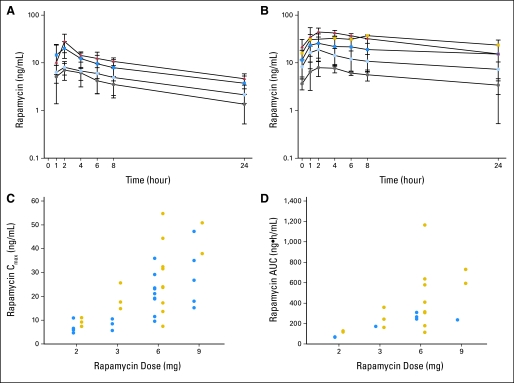
Fig 2.
Average plasma concentration time curve for rapamycin administered orally during day (A) 1 and (B) 28. (A and B) The gray circles, light blue circles, dark blue squares, and red triangles represent 2-, 3-, 6-, and 9-mg dose levels, respectively. Yellow squares represent two patients who had their doses reduced from 9 to 6 mg. The error bars are the standard deviation. Rapamycin maximum plasma concentrations (Cmax; C) and area under the concentration-time curve (AUCinf v day 28 AUC0-24; D) as a function of dose level. (C and D) The blue and yellow circles represent days 1 and 28, respectively.

