
Figure 8.
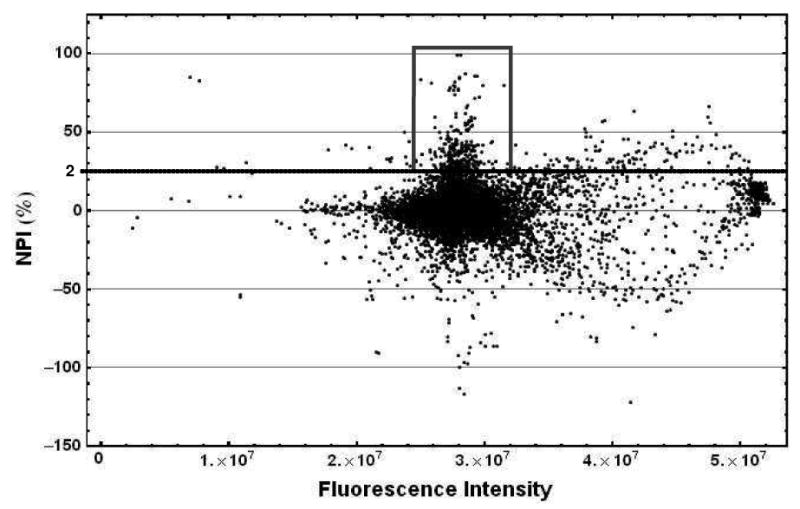
Plot of the normalized percentage inhibition versus fluorescence intensity for all the wells containing library compounds in the HTS performed against BasE. The box shows the position of the hit compounds in the screening, namely those with NPI > 25% and fluorescence intensity within +/- 10% of the average value for the plate.