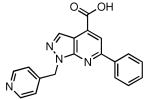
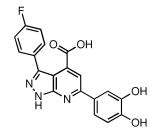
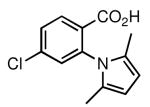
Table 4.
Structure, NPI, and KD's of top hits discovered in HTS against BasE.
| Compound # | Structure | NPI (%)a | KD (μM)b |
|---|---|---|---|
| 23 |  |
99 | 0.078 ± 0.007 |
| 24 |  |
80 | 2.86 ± 0.24 |
| 25 |  |
78 | 4.22 ± 0.28 |
| 26 |  |
76 | 4.95 ± 0.50 |
| 27 |  |
58 | 14.1 ± 1.6 |
| 28 |  |
61 | 15.0 ± 1.0 |
| 29 |  |
42 | 20.2 ± 1.3 |
| 30 |  |
44 | 22.1 ± 1.4 |
| 31 |  |
59 | 23.8 ± 1.8 |
| 32 |  |
85 | 28.6 ± 2.1 |
| 33 |  |
40 | 29.3 ± 3.1 |
The NPI values determined from HTS data.
KD determined by a FP competitive binding assay in triplicate. Values represent the mean and standard error.
