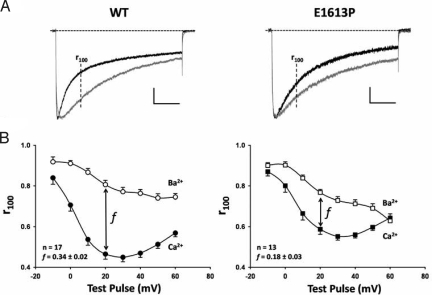
Fig. 5.
Inhibition of CDI by the E1613P mutation in CaV1.2. (A) representative CaV1.2 current inactivation of wild-type (Left) and E1613P (Right) CaV1.2 channels elicited by a 500-ms depolarization to +20 mV in either 10 mM Ca2+ (black traces) or 10 mM Ba2+ (gray traces). Ca2+ current traces were normalized to the peak of the corresponding Ba2+ current trace. The vertical scale bar represents 230 pA and 200 pA for the wild-type Ca2+ and Ba2+ currents, respectively and 470 pA and 260 pA for the E1613P Ca2+ and Ba2+ currents, respectively. (B) average (± SE) ratio of current remaining 100 ms after depolarization (r100) to the corresponding peak Ca2+ (filled symbols) and Ba2+ (open symbols) current plotted as a function of test potential for wild-type (Left) and E1613P (Right) CaV1.2. (Inset) (f) the difference between r100 in Ca2+ and Ba2+ and measure of CDI strength, is shown for the test potential of +20 mV (P < 0.01).

