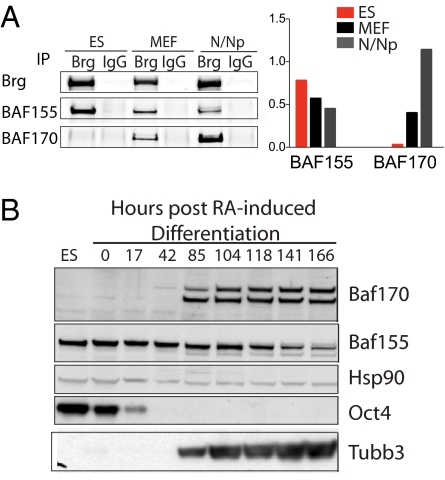
Fig. 3.
BAF155 and BAF170 developmental switch. (A) Quantitative immunoblotting of J1-purified complexes from ES cells, MEFs, and P0 brain (N/Np) for BAF155 and BAF170 (Left). Levels of 2 proteins were normalized to levels of Brg for comparison between the 3 cell types (Right). (B) Immunoblotting of whole-cell extracts from ES cells treated with RA under nonadherent growth conditions without leukemia inhibitory factor for the indicated time points.

