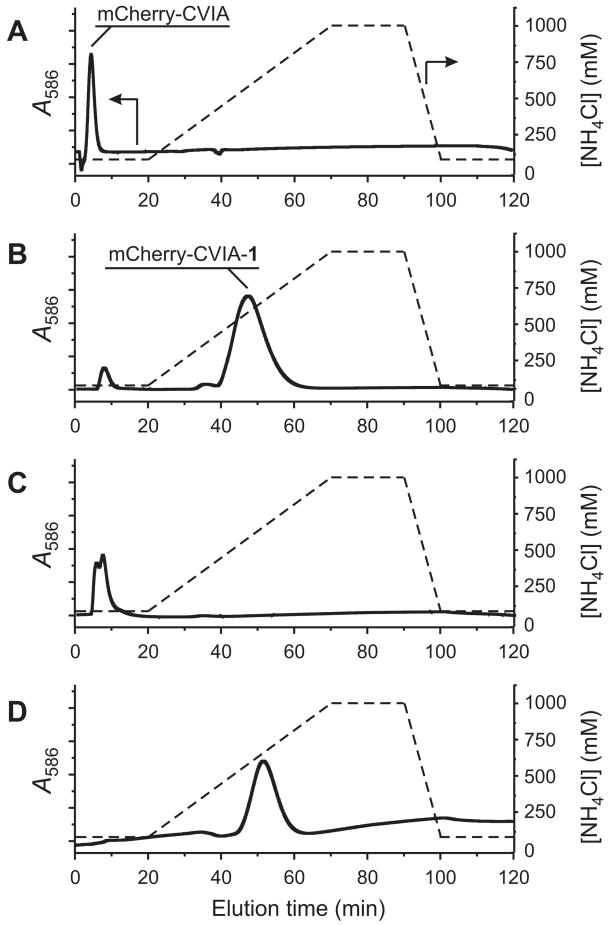
Fig. 3.
FPLC analysis, using a β-CD-Sepharose column, of in vitro farnesylation reactions of between mCherry-CVIA and 1-PP, catalyzed by PFTase. (A) Pure mCherry-CVIA, prior to farnesylation. (B) Product mixture (containing both mCherry-CVIA and mCherry-CVIA-1) after prenylation. Based on peak integrations, 95% of mCherry-CVIA was prenylated under these conditions. (C) Fraction collected over t = 6–15 min from run B, reinjected onto the FPLC column. (D) Fraction collected over t = 42–60 min from run B, reinjected onto the FPLC column. Solid lines: Relative optical absorbance of eluent at λ = 586 nm, measured on-line. Dashed lines: Illustration of the NH4Cl salt gradient.

