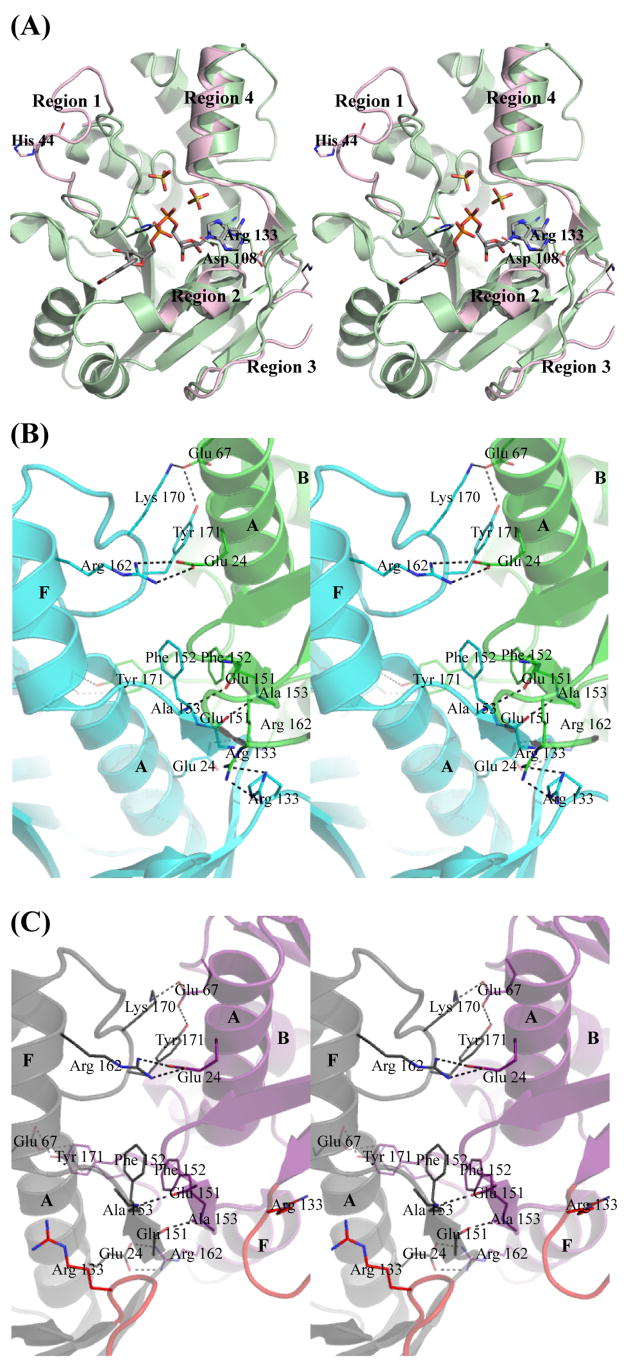
Figure 8. Conformational changes and dimerization interface of B. anthracis NMAT.
(a) Major conformational changes are labeled as regions 1–4. The NaAD-complex structure is shown in green. Only the regions of conformational change seen in the apoenzyme are shown in pink. (b) Dimerization interface of the apo and NaMN-bound NMAT. Chain A is shown in blue and chain B is shown in green. (c) Dimerization interface of the NaAD-bound NMAT. Chain B is shown in gray and chain C is shown in purple. The loop between β-strands 5 and 6 is shown in red in both chains. α-helices are labeled in letters.

