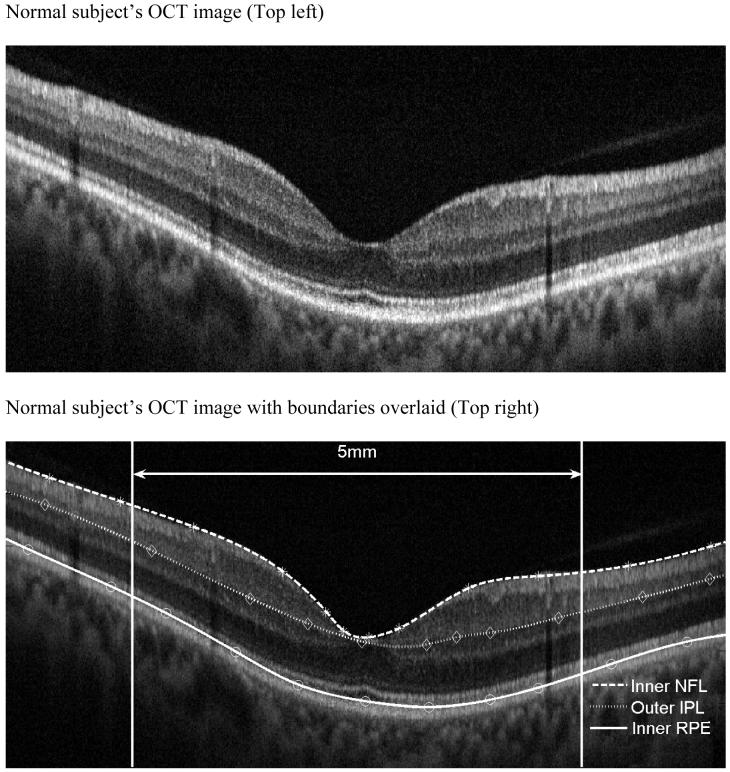
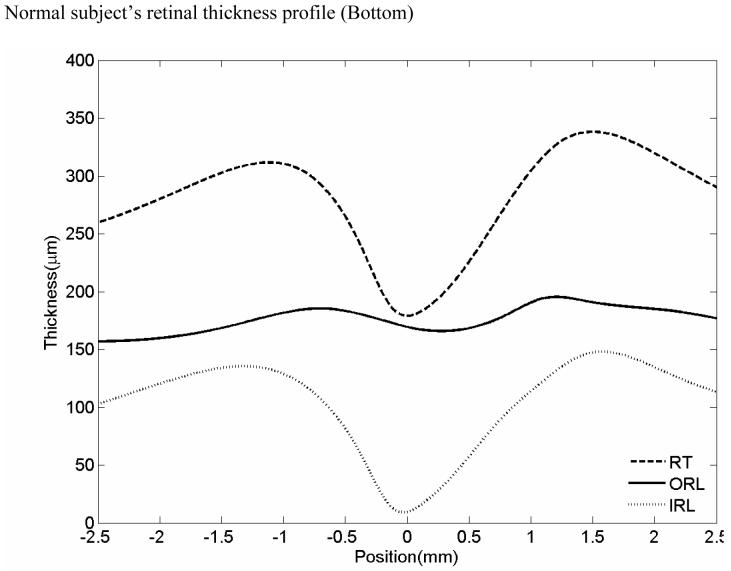
FIGURE 1.
Boundary drawing and retinal thickness measurement
OCT image of a normal patient (Top left). Inner Nerve fiber layer (NFL), outer inner pelxiform layer (IPL) and inner retinal pigment epithelium (RPE) boundaries are indicated on the figure as the dashed colored lines (Top right). Normal subject’s OCT image with boundaries overlaid. Mean retinal thickness plotted as a function of eccentricity from the foveal center (microns) (Bottom). Mean value is the central dashed line. Flanking lines represent the 95 % confidence intervals.


