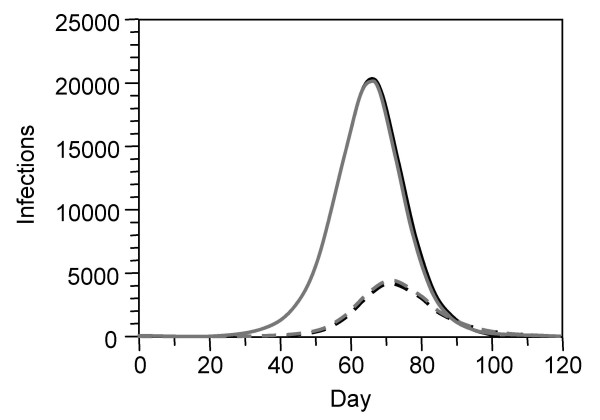
Figure 4.
Comparison of de novo development of resistance and importation of resistance. Prevalence of infection with drug sensitive (solid curves) and drug resistant infection (dashed curves) during a pandemic wave in a population of 100,000 inhabitants. Scenario (a): a drug-sensitive infection is introduced on day 0; NI resistant infection develops de novo during antiviral treatment of cases throughout the simulation (treatment parameters see Figure 2; no prophylaxis; 100% fitness of the resistant virus; black curves). Scenario (b): the importation of a drug sensitive infection on day 0 is followed by an importation of a NI resistant infection on day 28. Treatment is given as in scenario (a), but no de novo development of resistance occurs within this scenario (grey curves). The resulting curves for Scenario (a) and (b) are nearly indistinguishable.

