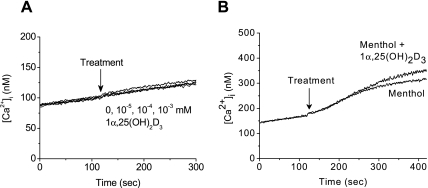
Fig. 2.
Intracellular Ca2+ change in LNCaP cells exposed to 1α,25(OH)2D3 and menthol. The [Ca2+]i was measured using Fura-2 as described in Materials and Methods (A) The effect of 1α,25(OH)2D3 on [Ca2+]i. (B) The effect of menthol alone (0.8 mM) or 1α,25(OH)2D3 (10−4 mM) plus menthol (0.8 mM) on [Ca2+]i. Data shown are a representative result of at least three independent experiments. Arrows indicates the point of treatments with 1α,25(OH)2D3 and/or menthol.

