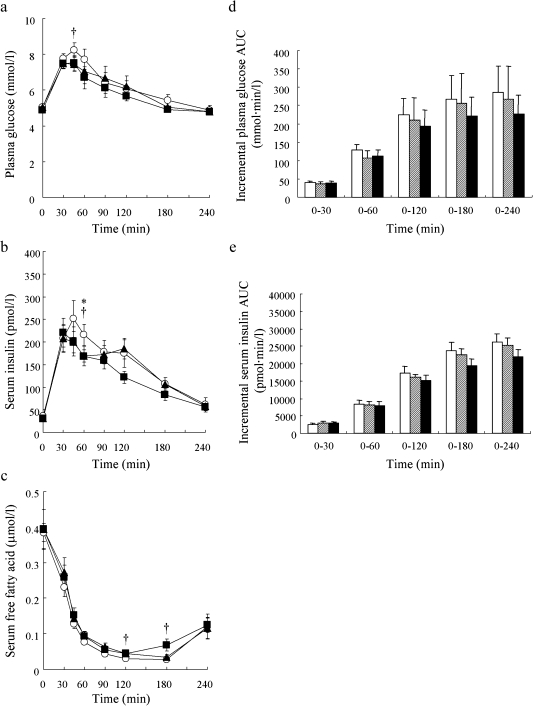
Fig. 2.
Postprandial plasma glucose (a), serum insulin (b) and serum free fatty acid (c) levels and incremental plasma glucose AUC (d) and serum insulin AUC (e) after ingestion of the 3 test meals (white rice, 30% barley, 50% barley). Open circle, white rice (WR); closed triangle, 30% barley (30BAR); closed square, 50% barley (50BAR). White bar, white rice (WR); hatched bar, 30% barley (30BAR); black bar, 50% barley (50BAR). *p<0.05, WR vs 30BAR; †p<0.05, WR vs 50BAR. Mean values with their standard errors.

