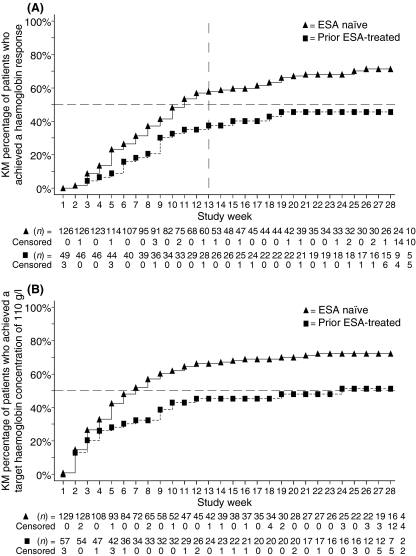
Fig 3.
Kaplan–Meier plots of the time to haemoglobin response and of the time to target haemoglobin over the 28-week treatment period. (A) The time to haemoglobin response for erythropoiesis-stimulating agent (ESA)-naïve patients and prior ESA-treated patients. (B) The time to target haemoglobin for ESA-naïve patients and prior ESA-treated patients. n below each graph represents the number of patients at risk for an event (patients were censored after an end-point was achieved).

