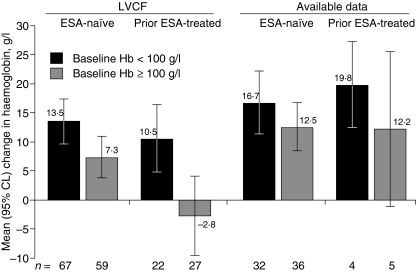
Fig 4.
Change in haemoglobin from baseline to week 53/55. Data are presented from an analysis using the last-value-carried-forward (LVCF) approach and from an analysis using available data. The mean change in haemoglobin is shown by baseline haemoglobin category. Error bars indicate the upper and lower 95% CL. ESA, erythropoiesis-stimulating agent; CL, confidence limit.

