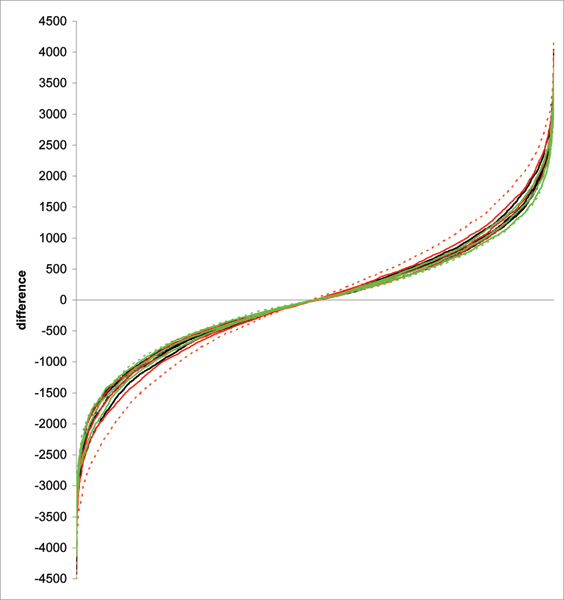
Figure 1.
Differences in ranking of individuals based on EBV and on GBVs. Individual differences in ranks based on EBV and different GBV models and for different SNP data sets, calculated for animals from the first four generations and sorted in ascending order. Model 1 is represented by black curves, model 2 – by red curves, and model 3 – by green curves. The best (lowest differences) and the worst (highest differences) models are represented by dashed curves.

