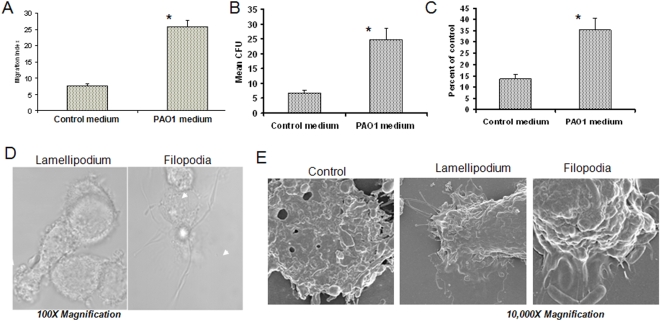
Figure 1. Conditioned medium from AECII by PAO1 infection activated AM (12 h).
(A) Increase of AM migration as determined by chemotaxic chamber methods (see Material and Methods). Migration index was calculated based on conditioned medium or control medium. (B) Increase in phagocytosis of AM as detected by CFU (colony forming units). (C) Increase in superoxide production of AM analyzed by H2DCF fluorescence (Molecular Probes). (D) The morphology of the activated AM is shown typically with lamllipodium and filopodium by confocal microscopy. (E) The morphology of the activated AM is further evidenced by high resolution and magnification Scanning Electron Microscopy (SEM). Statistical analysis was done by comparing mean individual values versus controls using student's t test, *p<0.05 (95% Confidence Interval, CI). The results are representative of three experiments.

