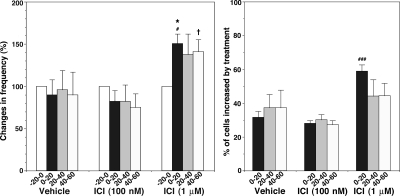
Figure 10.
ICI 182,780 at 1 μm caused an increase in the frequency of [Ca2+]i oscillations (left) and the percent of stimulated cells (right). For comparison, the data from the treatments with vehicle and 100 nm ICI 182,780, reported in a previous study (11) are included. *, P < 0.05 vs. −20-0 (within treatment); #, P < 0.05 vs. vehicle or ICI (100 nm); ###, vs. vehicle or ICI (100 nm) at corresponding time (between treatments); †, P < 0.05 vs. ICI at 100 nm, at corresponding time (between treatments).

