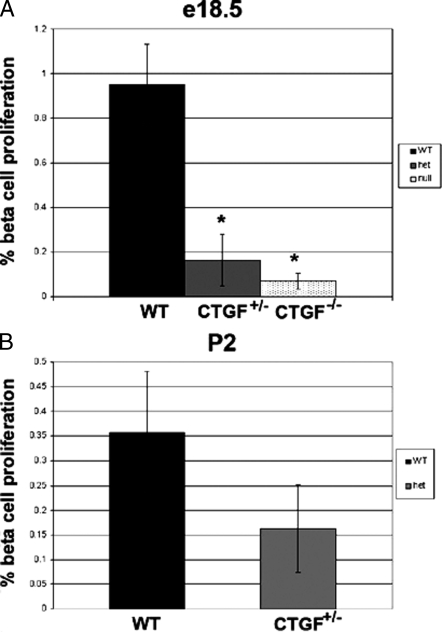
Figure 8.
CTGF mutant animals have reduced β-cell proliferation. A, β-Cell proliferation at e18.5 in WT (dark bar, n = 3), CTGF heterozygotes (light bar, n = 3), and CTGF null (stippled bar, n = 3) animals. B, β-Cell proliferation at P2 in WT (dark bar, n = 3) and CTGF heterozygotes (light bar, n = 3). Proliferation was assessed using double immunofluorescence for insulin and phosphorylated histone H3 as described in Materials and Methods. Error bars determined by sem. *, P < 0.05 compared with WT (determined by Student’s t test).

