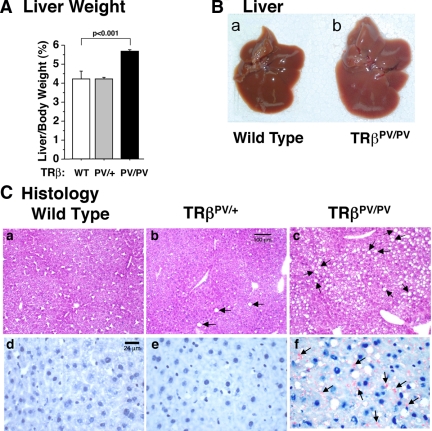
Figure 2.
Enlarged fatty liver of TRβPV/PV mice. A, Comparison of liver weight of wild-type, TRβPV/+, mice, and TRβPV/PV mice aged 4–5 months. Ratios of tissue mass vs. body weight were determined. The data are expressed as mean ± sem (n = 4–9; the P value is indicated). B, Representative liver of a wild-type mouse (a) and TRβPV/PV mouse (b), showing a larger liver of TRβPV/PV mouse with grayish appearance. C, Hematoxylin- and eosin-stained (a–c) or Oil Red-O-stained (d–f) liver of a wild-type mouse (a and d), TRβPV/+ mouse (b and e), and TRβPV/PV mouse (c and f). Arrows indicate the accumulation of lipids.

