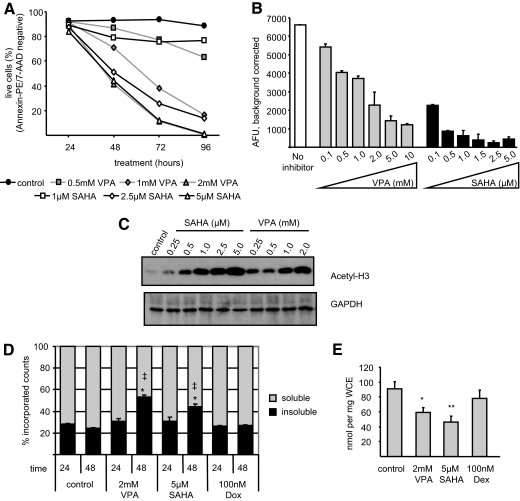
Figure 2.
Treatment with HDACI results in apoptosis and decreased cellular levels of soluble acetyl-CoA. A, OPM2 cells were treated with VPA or SAHA before analysis of apoptosis using 7-AAD and annexin V PE staining followed by FACS. Values indicate the average percent remaining live (unstained) cells per treatment in triplicate samples. B, Nuclear extracts from untreated OPM2 cells were incubated with the indicated concentrations of VPA or SAHA before analysis of HDAC activity. C, OPM2 cells were incubated 24 h with SAHA or VPA before lysis and immunoblot analysis. D, OPM2 cells were incubated with [3H]acetate before addition of VPA, SAHA, or Dox and then were lysed and deproteinated, and counts were measured in soluble and insoluble fractions. *, P < 0.001 as compared with time-matched control; ‡, P < 0.01 comparing VPA and SAHA treatments. E, OPM2 cells were treated 48 h with VPA, SAHA, or Dex. Acetylcarnitine levels were measured as in Fig. 1. * and **, P < 0.05 and P < 0.01, respectively, as compared with control. Results are representative of at least three independent experiments, and values indicate mean ± sd of triplicate samples. Significance was determined by one-way ANOVA followed by Tukey comparison test.

