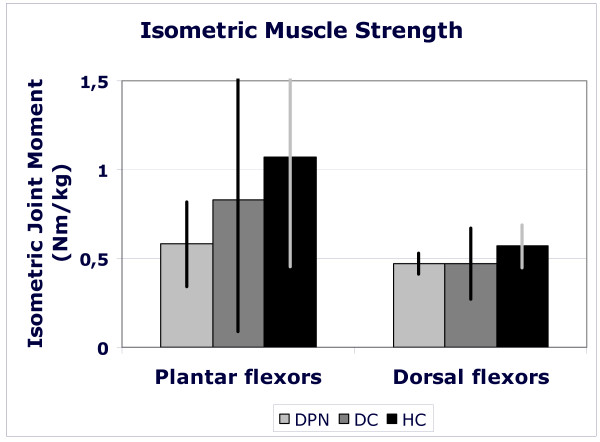
Figure 2.
Maximal, voluntary, isometric strength of plantar and dorsal flexor muscle groups for health elderly (black bars), people with diabetes without polyneuropathy (dark grey bars) and people with diabetic polyneuropathy (light grey bars). Muscle strength is expressed as the joint moment exerted in a dynamometer normalized for body mass (Nm/kg). Bars represent mean values for a group; standard deviations are presented as vertical lines.

