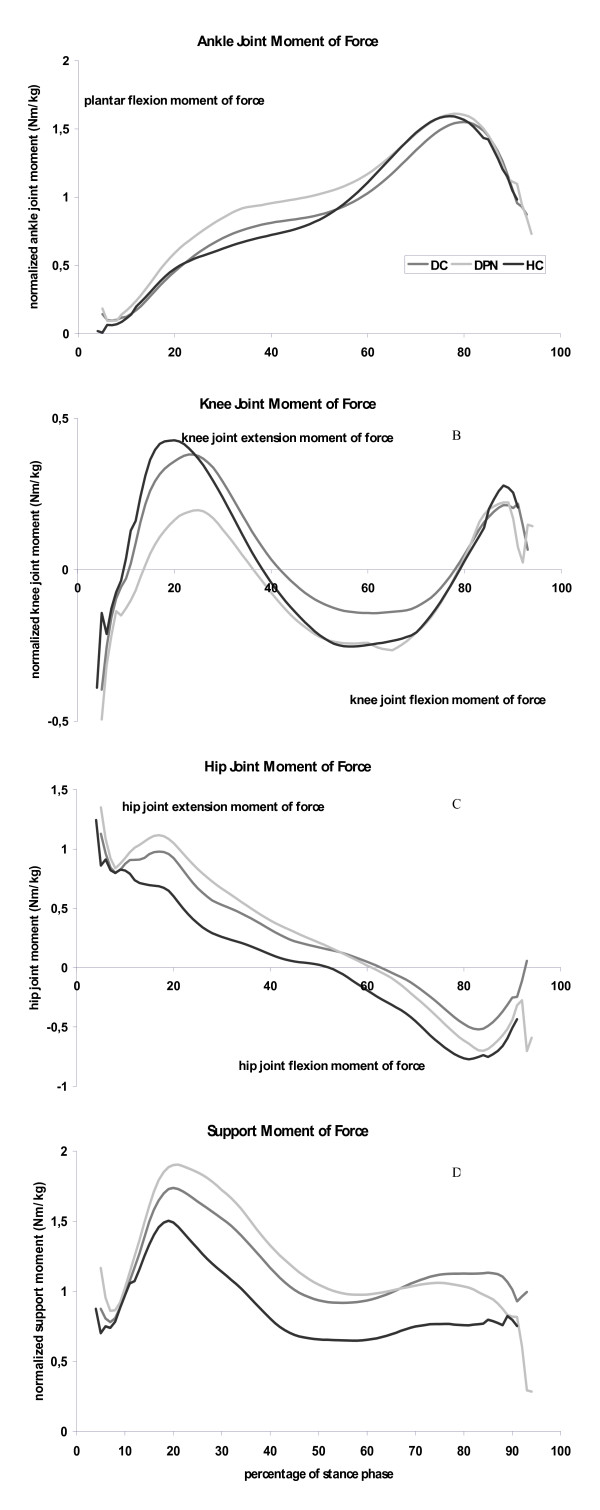
Figure 4.
Joint moment patterns as a function of the stance phase for health elderly (black lines), people with diabetes without polyneuropathy (dark grey lines) and people with diabetic polyneuropathy (light gray lines). Graphs represent the internal joint moments, and are averaged values for each group. 4a: Ankle joint moment, positive values indicate plantar flexor muscle moments. 4b: Knee joint moment, positive values indicate knee joint extensor muscle moments. 4c: Hip joint moment, positive values indicate hip joint extensor muscle moments. 4d: Support moment, representing the summation of ankle, knee and hip joint moments.

