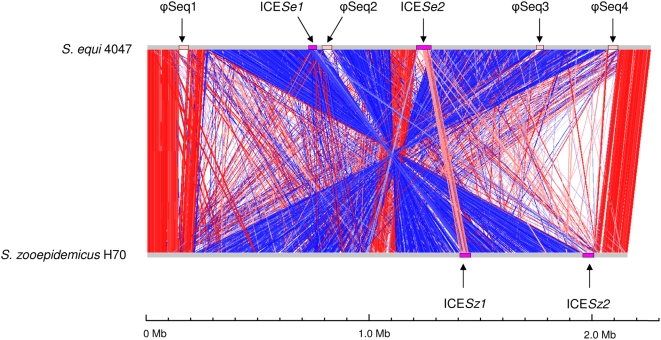
Figure 2. Pairwise comparison of the chromosomes of Se4047 and SzH70 using ACT.
The sequences have been aligned from the predicted replication origins (oriC; right). The colored bars separating each genome (red and blue) represent similarity matches identified by reciprocal TBLASTX analysis [71], with a score cutoff of 100. Red lines link matches in the same orientation; blue lines link matches in the reverse orientation. The prophage (pink) and ICE (purple) are highlighted as colored boxes.

