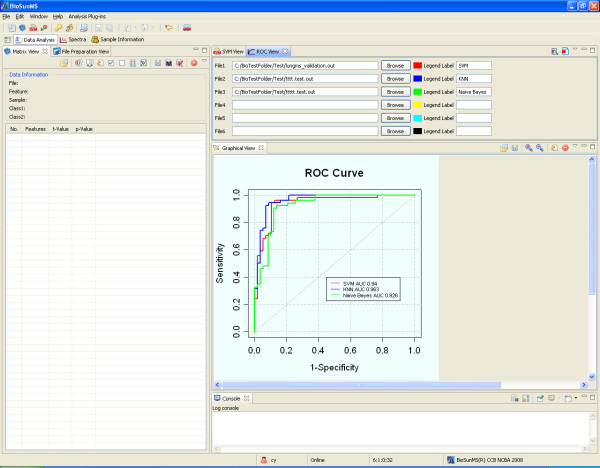
Figure 5.
The screen shot of ROC curve. The ROC curve is used to evaluate the performance of model. The demonstrated example provides the ROC curves for classifiers constructed from SVM, KNN and Naive Bayes methods, respectively, and the correspondent areas under the ROC Curve are 0.94, 0.963 and 0.926.

