Figure 3.

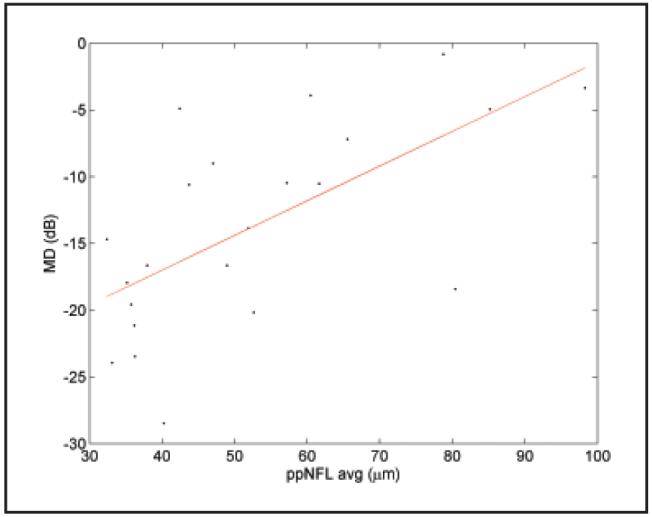
Plot of visual field mean deviation (MD) versus peripapillary nerve fiber layer overall average (ppNFL AVG). R2 = 0.37, slope = 0.26 dB/μm, P < .0001.

Plot of visual field mean deviation (MD) versus peripapillary nerve fiber layer overall average (ppNFL AVG). R2 = 0.37, slope = 0.26 dB/μm, P < .0001.