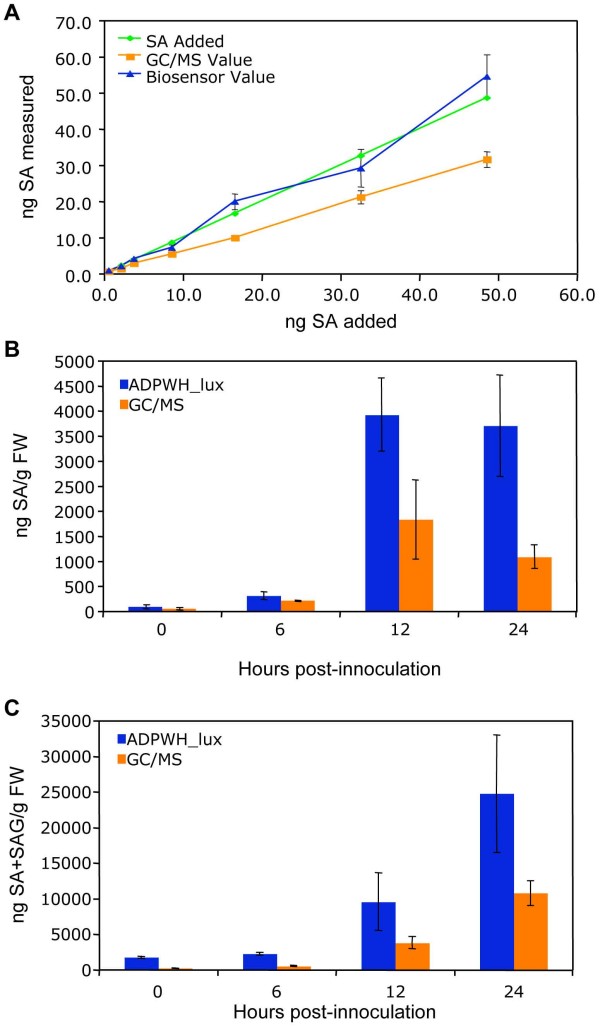
Figure 3.
Comparison of ADPWH_lux- and GC/MS-based methods for SA quantification. (A) Quantification of SA from plant extracts with known amounts of SA added. The same extracts were used for SA quantification with each method. (B) Free SA from Psm ES4326-infected wild type. Known SA amounts added were 0.6, 2.2, 3.8, 8.6, 16.6, 32.6, and 48.6 ng. (C) SA+SAG from Psm ES4326-infected wild type. Values are the mean of 8 samples read in triplicate with standard deviation.

