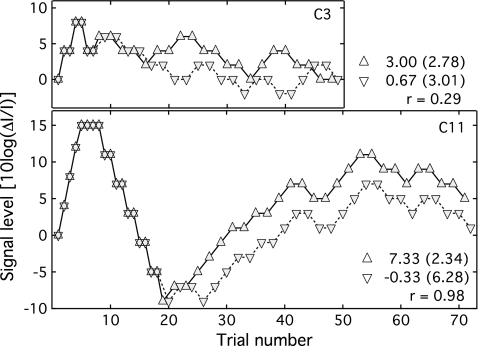
Figure 1.
Signal intensity is plotted as a function of trial number for two observers. The top panel shows data for C3, which is representative of the child data. The bottom panel shows data for C11, a unique case where the two interleaved tracks were highly correlated. Symbols reflect the two tracks, which do not diverge until after the second track reversal. The legend shows the mean and standard deviation associated with each track, as well as the correlation between tracks.

