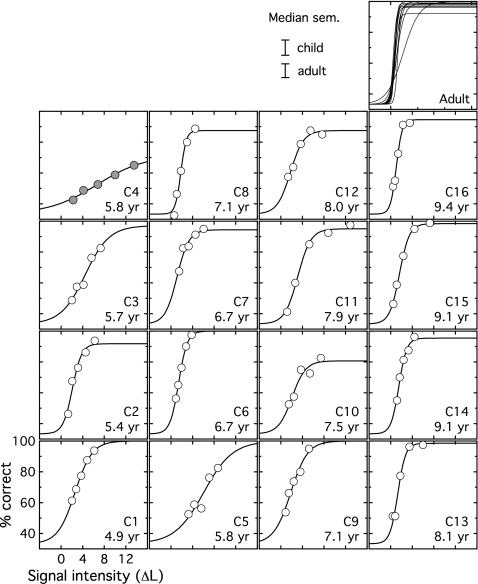
Figure 2.
Percent correct data are shown for individual child observers, plotted in percent correct as a function of intensity increment in units of ΔL. The circles show data, and the lines show data fits. Observer age is indicated in each panel, and panels are arranged with child age increasing from left to right. All adult data fits are shown in the upper right panel. The legend indicates the median standard error of the mean for each group. The filled symbols in the upper left panel highlight the fact that results of observer C4 are markedly poorer than those of other observers, as discussed in the text.

