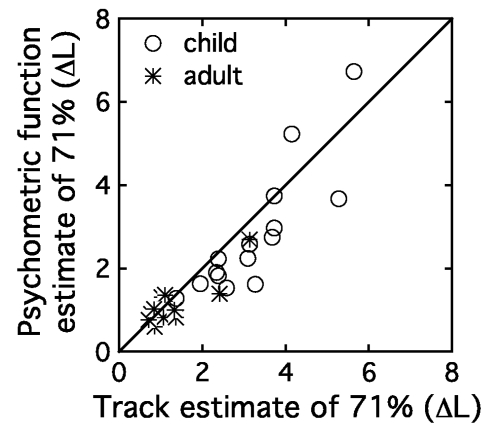
Figure 3.
Threshold estimates based on psychometric function fits are plotted as a function of thresholds estimated in the initial tracking procedure both in units of ΔL. The circles show child data, and the stars indicate adult data. The diagonal line indicates perfect correspondence between these two estimates of 71% correct.

