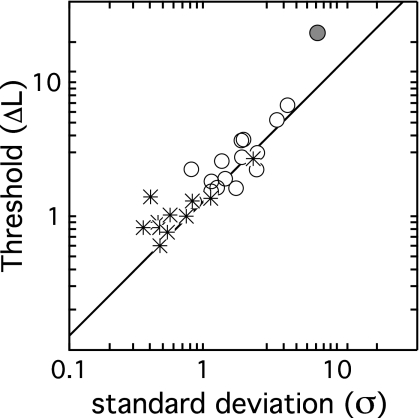
Figure 5.
Thresholds in ΔL are plotted as a function of the standard deviation of the underlying cue distribution (σ), estimated for each observer based on psychometric function slope. Child data are shown with circles, and adult data are shown with stars. The solid line indicates the threshold predicted based on σ, as described in the Appendix.

