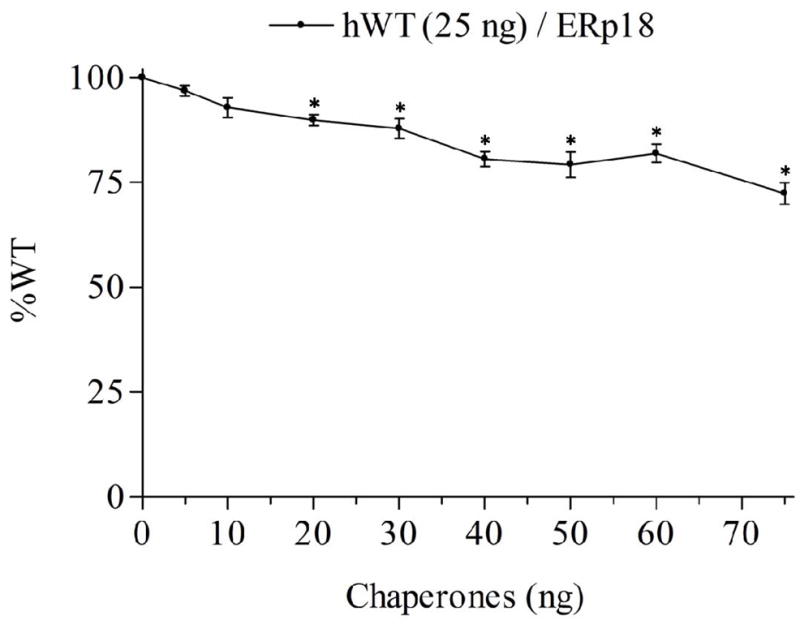
Figure 1.

WT% indicate the IP production upon Buserelin stimulation of Human WT GnRHR co-transfected with hERp18 chaperone. Mean ± SEM of at least three independent experiments in triplicate incubations. The asterisks indicate P<0.05 compared with WT hGnRHR (25 ng) without ERp18 co-transfected. The experiment was analyzed with one-way ANOVA followed by the Bonferroni post test.
