
Figure 2.
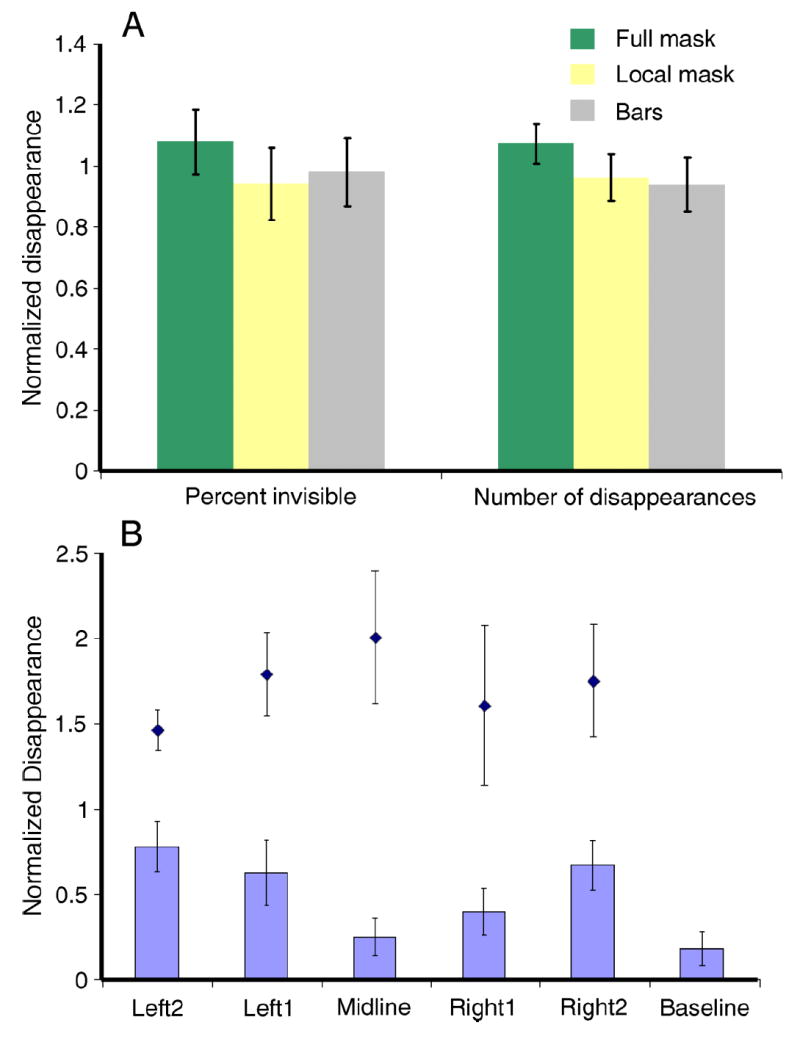
Results of Experiment 1. (A) Average of normalized (to average under all 3 conditions) time of invisibility (left) and number of disappearances (right) under Full Mask (green), Local Mask (yellow) and Flashing Bars (gray). (B) Reduced masking when target and mask are in different hemifields. Midline stimulus is shown in Figure 1D. Black diamonds show the average normalized disappearances for the full-mask control condition when the target was at the same locations as used to test the same vs. different hemifield conditions. Data are normalized to the average of the 11 conditions (5 with partial mask, 5 with full mask and one without a mask). Error bars represent the standard error.