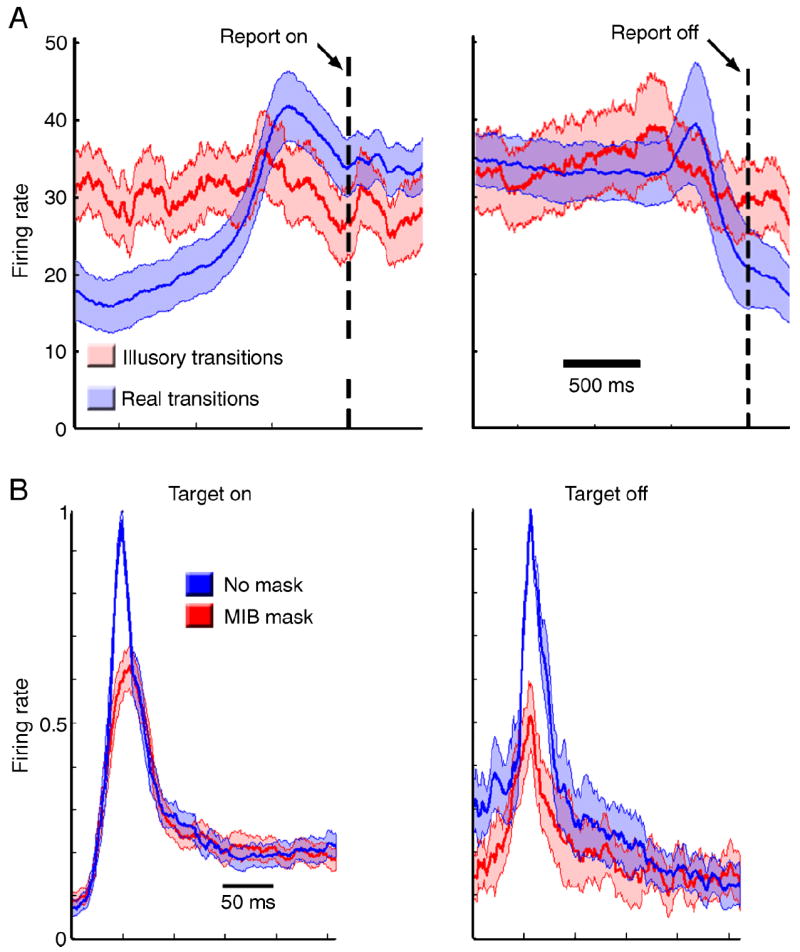
Figure 4.

Results of Experiment 2. (A) Average responses of V1 cells when the monkey reported target appearance (left) and target disappearance (right) for illusory (red) or real (blue) transitions. Activity is aligned with the time of lever press, indicated by the dotted line. The shaded area denotes standard error. (B) Population average of V1 cells during passive fixation (mean ± standard error) to target ON (left) and target OFF (right) from cells with ON and OFF responses respectively. The blue line represents the average firing rate when no mask was present and red the average firing rate when the MIB mask was present. Responses were aligned by time to peak and normalized by the maximum firing rate for each cell.
