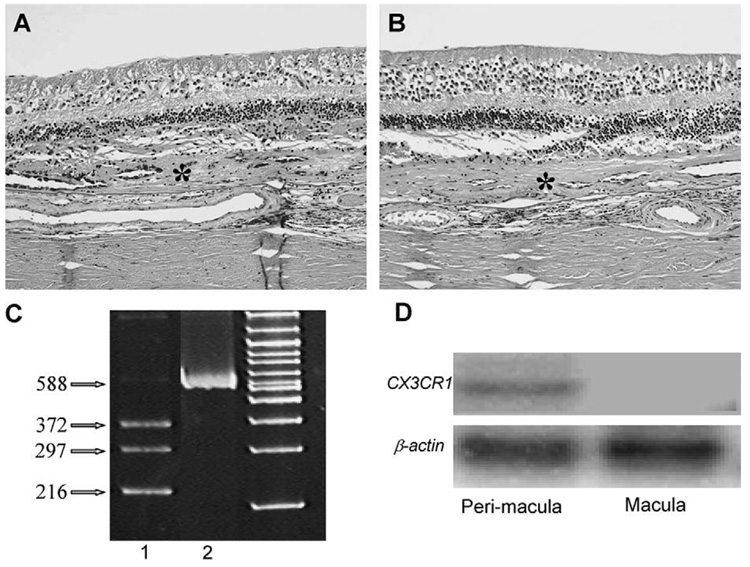
Figure 4.
Photomicrograph showing typical AMD with large disciform scars (asterisks) between the neuronal retina and Bruch membrane, loss of photoreceptors, and normal RPE cells (A, right eye; B, left eye; hematoxylin & eosin, original magnification, ×100). C, The gel image of the RFLP pattern showing heterozygous CX3CR-280 (T/M) with 216, 297, and 372 bp (lane 1), uncut in lane 2. D, Reverse transcription-PCR of CX3CR1 mRNA in the macular and perimacular regions showing no CX3CR1 in the macula but equal expressions of β-actin mRNA on both regions (small amplicons of 100 bp spanning from exon 1 and exon 2 of CX3CR1, and 103 bp spanning from exon 5 to exon 6 of β-actin were amplified using 32P-labeled primers. Polymerase chain reaction products were separated by gel electrophoresis. Images were captured by autoradiography.

