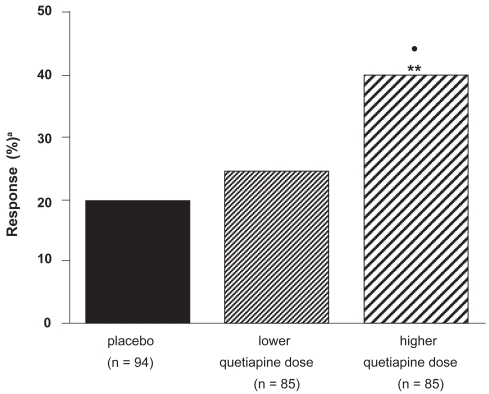
Figure 3.
Percentage of patients responding to higher (mean 439 mg/d) and lower (mean 229 mg/day) quetiapine doses, and placebo (compiled from data of Small et al 2002).
Note: patients receiving <150 mg/d of quetiapine were not analyzed.
•p < 0.05, quetiapine: higher vs lower dose; **p < 0.01, quetiapine: higher dose vs placebo; a≥40% reduction in Brief Psychiatric Rating Scale (BPRS) total score.

