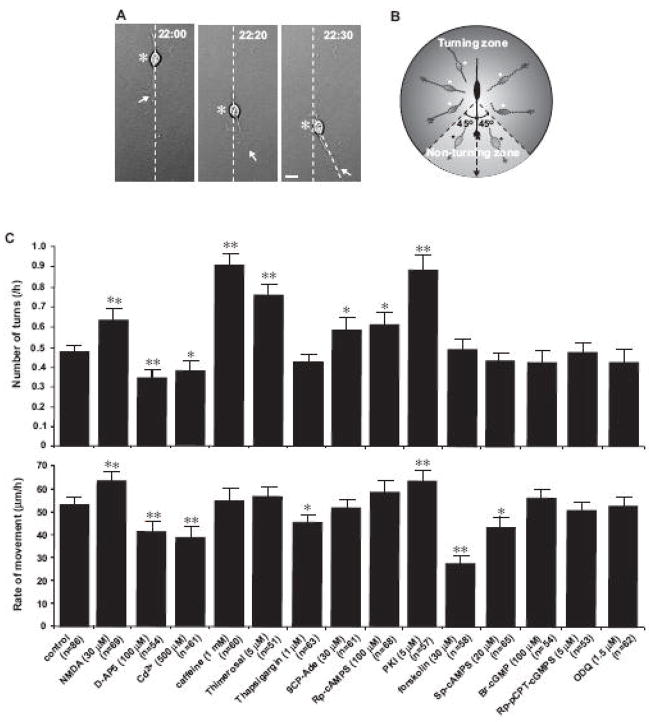
Fig. 2.
Modulation of the frequency of turning and the rate of migration of granule cells in vitro by altering the Ca2+ and cAMP signaling pathways. (A) Measurement of granule cell turning. In each photograph arrows and asterisks indicate the leading process and the soma of a granule cell, respectively. The numbers at the top of each photograph represent the elapsed time after in vitro. Bar: 10 μm.(B) Schematic representation showing how to identify and count the turning of granule cell. (C) Histograms showing the effects of the alterations of the Ca2+ and cyclic nucleotide signaling pathways on the frequency of turning (top histogram) and the rate of migration (bottom histogram) of granule cells. Each column represents the average frequency of turning and the average rate of migration obtained during a 10 hour-period of observation between 20–30 hours after in vitro. Each reagent was added to the culture medium at 20 hour after in vitro. Single (p <0.05) and double (p <0.01) asterisks indicate statistical significance. Bar: S.D.

