
Fig. 9.
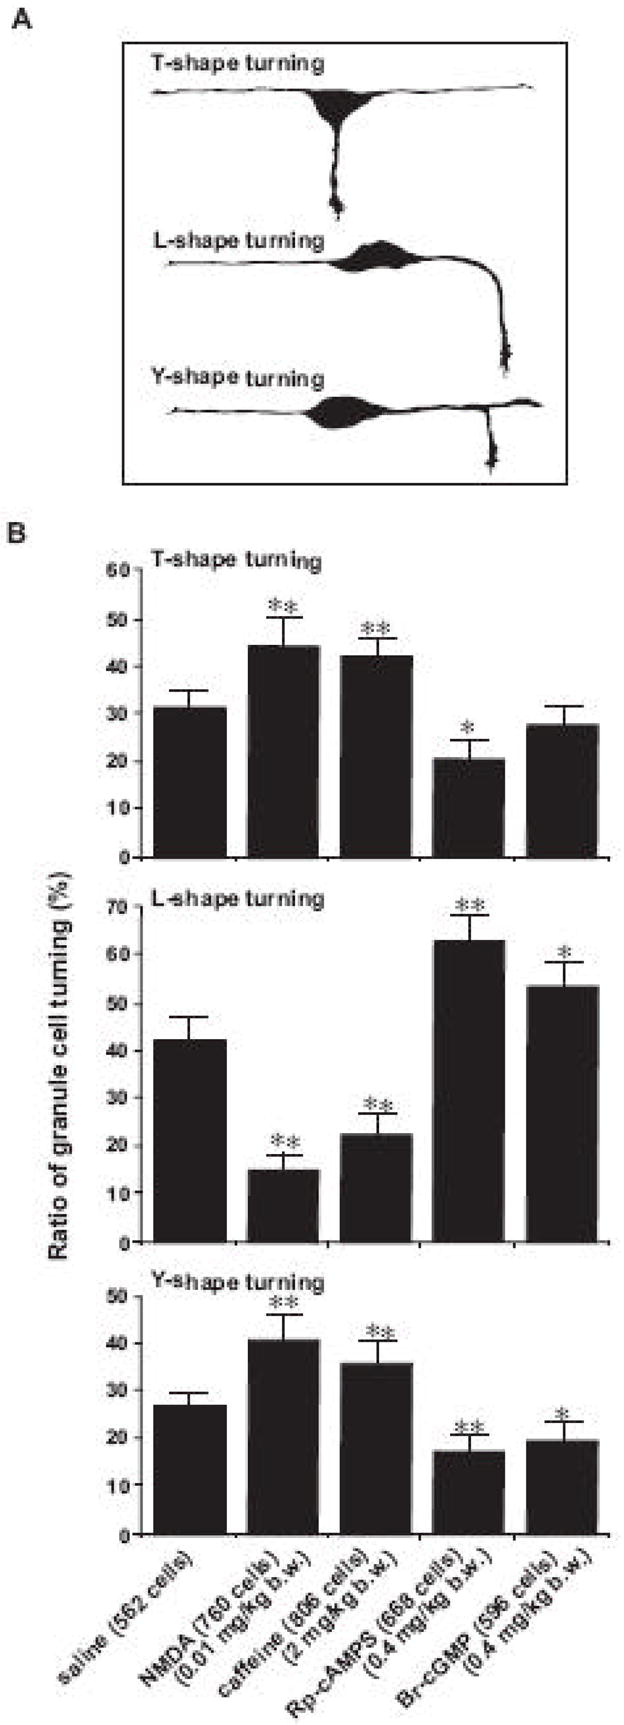
Changes in the ratio of the T-, L-, and Y-shape granule cell turning at the EGL-ML border of the P10 mouse cerebella by the application of saline, NMDA, caffeine, Rp-cAMP, or Br-cGMP. (A) Schematic representation of the T-, L-, and Y-shape granule cell turning in vivo. (B) Histograms showing the effects of the injection of saline, NMDA, caffeine, Rp-cAMP, or Br-cGMP on the ratio of the T-, L-, and Y-shape granule cell turning at the EGL-ML border. Single (p <0.05) and double (p <0.01) asterisks indicate statistical significance. Bar: S.D.