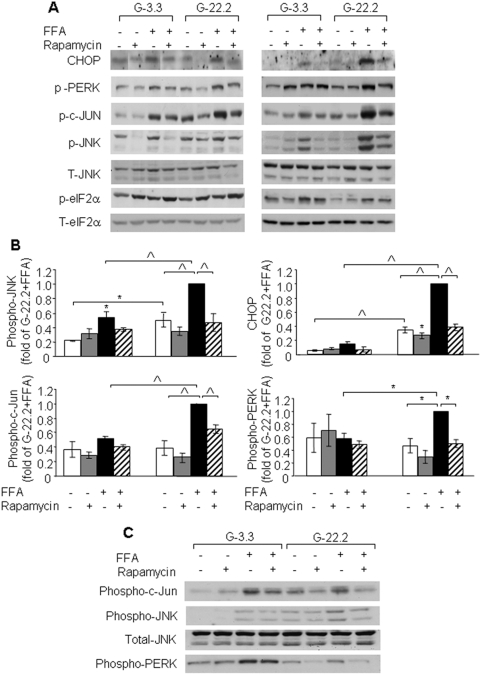
Figure 3. Effect of mTORC1 inhibition by rapamycin on glucose and palmitate-induced ER stress in β-cells and islets.
INS-1E cells were incubated at 3.3 and 22.2 mmol/l glucose with and without 0.5 mmol/l palmitate and 50 nmol/l rapamycin for 4 and 16 h; P. obesus islets were similarly treated for 24 h. Control incubations contained 0.5% BSA. ER stress was assessed by Western blot analysis for different ER stress markers. (A) A representative gel showing CHOP, phospho-PERK, phospho-c-Jun, phospho- and total JNK, phospho- and total eIF2α in INS-1E cells is presented. (B) Quantification of c-Jun, JNK, and PERK phosphorylation and CHOP expression at 16 h. Results are expressed as means±SE of 4 individual experiments. (C) A representative gel of 3 individual experiments showing phospho-c-Jun, phospho-PERK and phospho- and total JNK in P. obesus islets. * p<0.05, ∧ p<0.001 for the difference between the indicated groups or between the indicated groups and untreated controls at the same glucose concentration.

