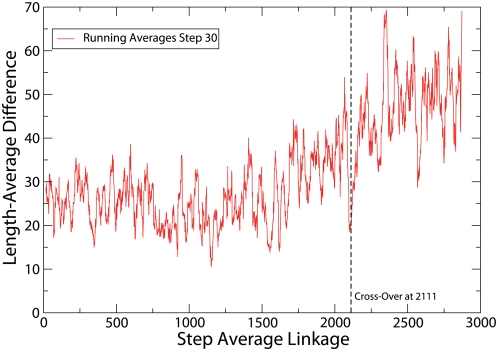
Figure 2. Difference between the mean lengths of the two joined clusters, Eq. (3), versus the average linkage step.
The cross-over of transitivity violations is depicted as a vertical line. One can see that length differences are significantly larger after the cross-over. To improve the representation, we performed running averages with window size of 30 steps.

