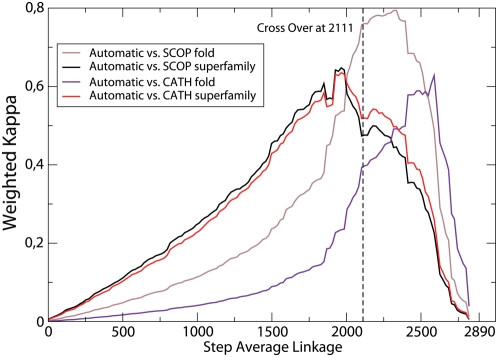
Figure 3. Weighted kappa measuring the agreement the average linkage classifications with step represented in the horizontal axis and SCOP and CATH superfamilies and folds.
Notice that the cross-over point, depicted as a vertical line, lies between the maximum agreement with superfamilies and the maximum agreement with folds.

