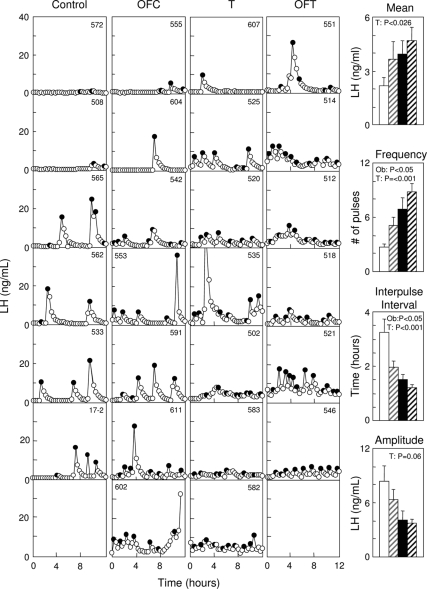
Figure 5.
LH pulse patterns during the nonbreeding season of control (C), OFC, T, and OFT females are shown on the left. Black circles depict LH pulses identified by the Cluster algorithm. Bar graphs show mean ± sem circulating levels of LH, LH pulse frequency (number of pulses/12 h), interpulse interval, and pulse amplitude (note one T and one OFT died before the anestrus study). White bar, control; gray striped bar, OFC; black bar, T; black striped bar, OFT. Ob, over-fed.

