Figure 1.
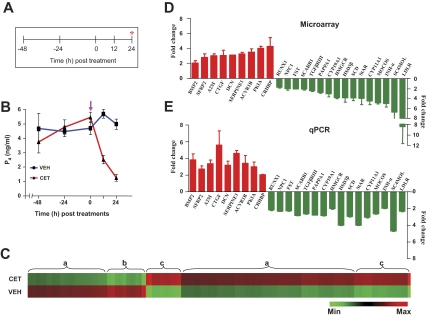
Effect of inhibition of pituitary LH secretion on gene expression changes in the monkey CL. A and B depict the experimental protocol and circulating P4 levels at different time points before and after injection of CET (indicated by arrows), a GnRH-R antagonist, 150 μg/kg BW sc on d 7 of the luteal phase in monkeys. The CL was harvested at the end of 24 h treatment. C, A heat map for all the probe sets from VEH and CET treatment groups (n = 5 monkeys per group) that were differentially expressed (>2-fold change; t test, P < 0.05). Each row represents the VEH and treatment group, respectively, and comprises a collection of probe sets corresponding to an individual transcript. Approximate regions of a similar set of differentially expressed genes are grouped and indicated as flower brackets with alphabets. Region a, Set of differentially expressed genes with relatively low regulation compared with b and c; region b, set of differentially expressed genes that is down-regulated; region c, set of differentially expressed genes that is up-regulated. D and E, Microarray and qPCR analyses of fold changes in the expressions of selected genes. More details are provided in the Results section. Max, Maximum; Min, minimum.

