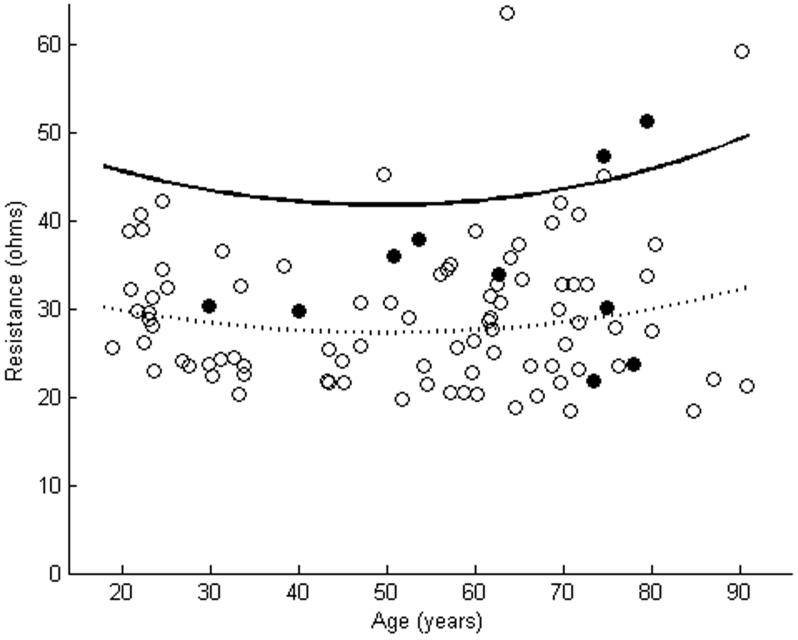
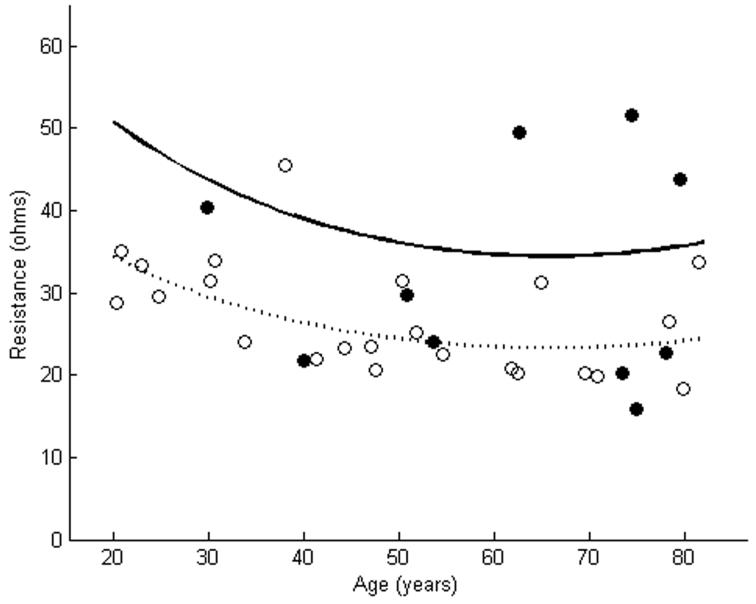
Figure 2.
R of tibialis anterior as measured using far-electrode arrays in 10 subjects with ALS is plotted against a cohort of normal subjects (a). In 2 of these cases, R of the ALS patients was greater than the upper limit of normal. R of tibialis anterior as measured using near-electrode arrays showed increases in 3 of 10 ALS patients (b). The dashed line represents the mean, while the solid line represents the upper limit of normal. Closed circles are patients with ALS. Open circles are normal controls.


