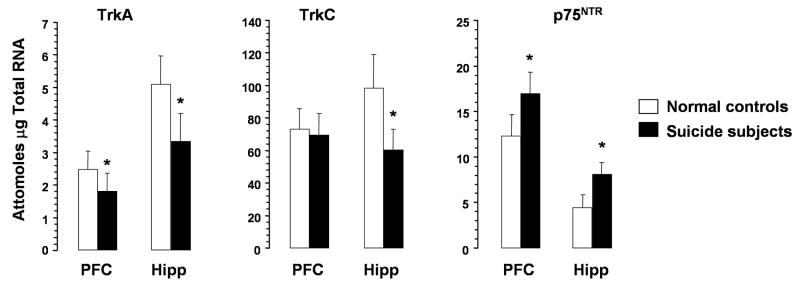
Figure 2.
mRNA levels TrkA, TrkC, and p75NTR in PFC and hippocampus of suicide subjects and normal controls. Data are the mean ± S.D. PFC samples were from 21 normal controls and 28 suicide subjects; hippocampus samples were from 21 normal controls and 26 suicide subjects. Hip, hippocampus. Overall ANCOVA in PFC and hippocampus were as follows: PFC: TrkA, df = 1,40, F = 37, P <0.001; TrkC, df = 1,42, F = 0.5, P = 0.47; p75NTR (df = 1,42, F = 33.6, P <0.001); hippocampus: TrkA, df = 1,40, F = 37, P <0.001; TrkC, df = 1,40, F = 52.1, P <0.001; p75NTR, df = 1,40, F = 72.4, P <0.001). * P <0.001.

