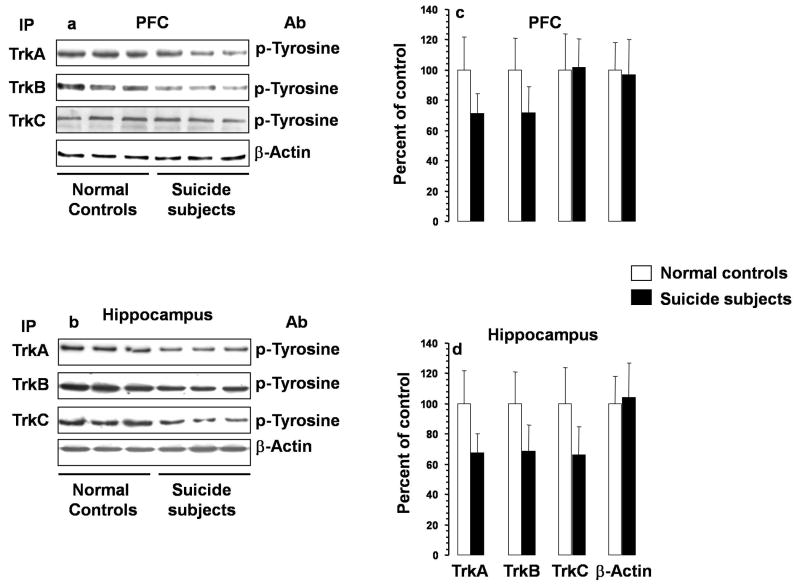
Figure 4.
Activation of TrkA, TrkB, and TrkC in PFC and hippocampus of suicide subjects and normal controls. Autoradiograms showing immunolabeling of phosphotyrosine in PFC (a) and hippocampus (b) determined after immunoprecipitation using TrkA, TrkB, or TrkC antibody. Mean ± S.D. of O.D. of bands of phosphotyrosine depicting activation of TrkA, TrkB, or TrkC in PFC (c) and hippocampus (d) of suicide subjects and normal controls. PFC samples were from 21 normal controls and 28 suicide subjects and hippocampus were from 21 normal controls and 26 suicide subjects. Overall ANCOVA: PFC: TrkA, df = 1,42, F = 26.5, p <0.001; TrkB: df = 1,42, F = 38.5, p <0.001; TrkC, df = 1,42, F = 0.03, p = 0.86; hippocampus: TrkA, df = 1,40, F = 33.7, p <0.001; TrkB, df = 1,40, F = 28.2, p <0.001; TrkC, df = 1,40, F = 27.7, p <0.001. * P <0.001. Ab, antibody; IP, immunoprecipitation.

